diagram that relationship between energy
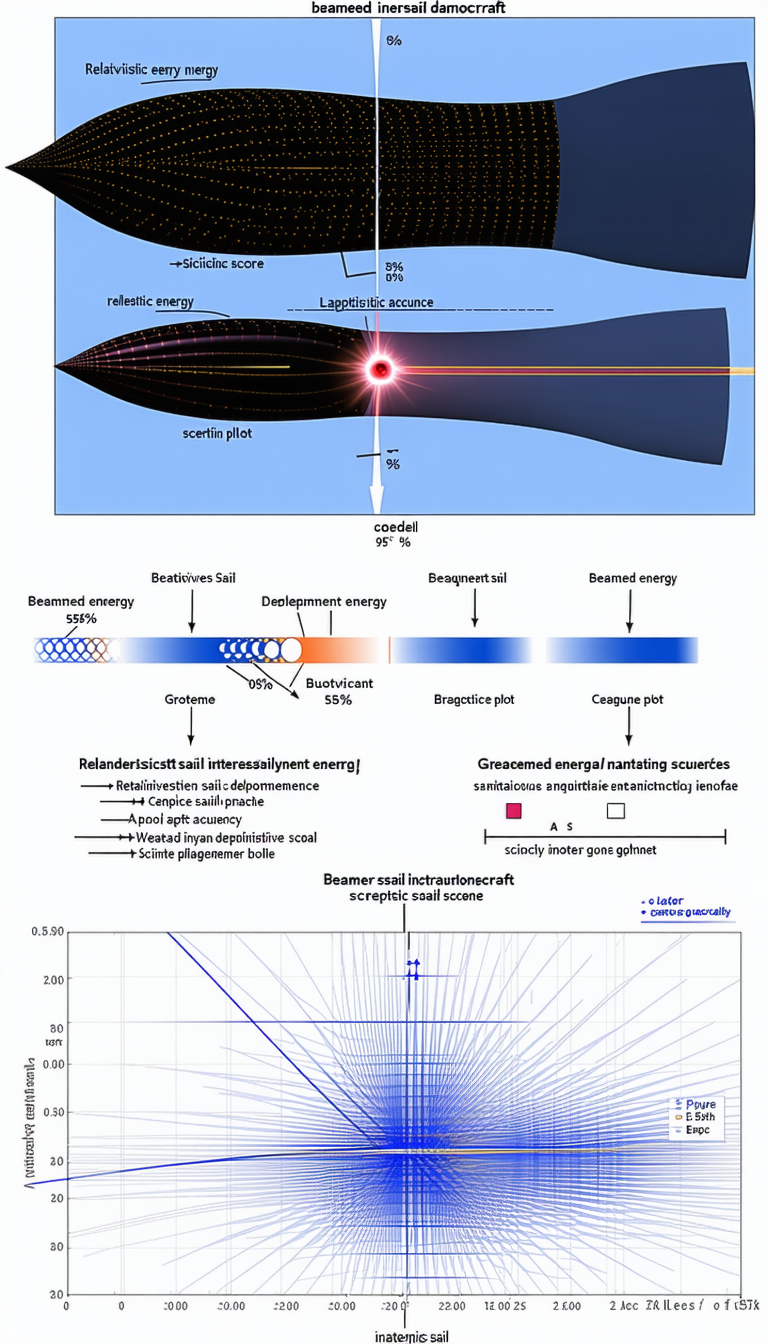
Description
The image is a diagram that shows the relationship between energy and the various stages of a rocket launch. The diagram is divided into several sections, each representing a different stage of the launch. The sections include the energy source, the energy transfer, and the energy utilization. In the energy source section, there is a description of the energy source, which is a nuclear reactor. The energy transfer section shows the energy transfer from the reactor to the rocket, which is done through a beam of energy. The energy utilization section displays the energy utilization in the rocket, which is used for propulsion. The diagram also includes a graph that shows the energy transfer rate, which is 100% at the beginning of the launch and decreases as the rocket gains altitude. The graph also shows the energy utilization rate, which is 100% at the beginning of the launch and decreases as the rocket gains altitude.