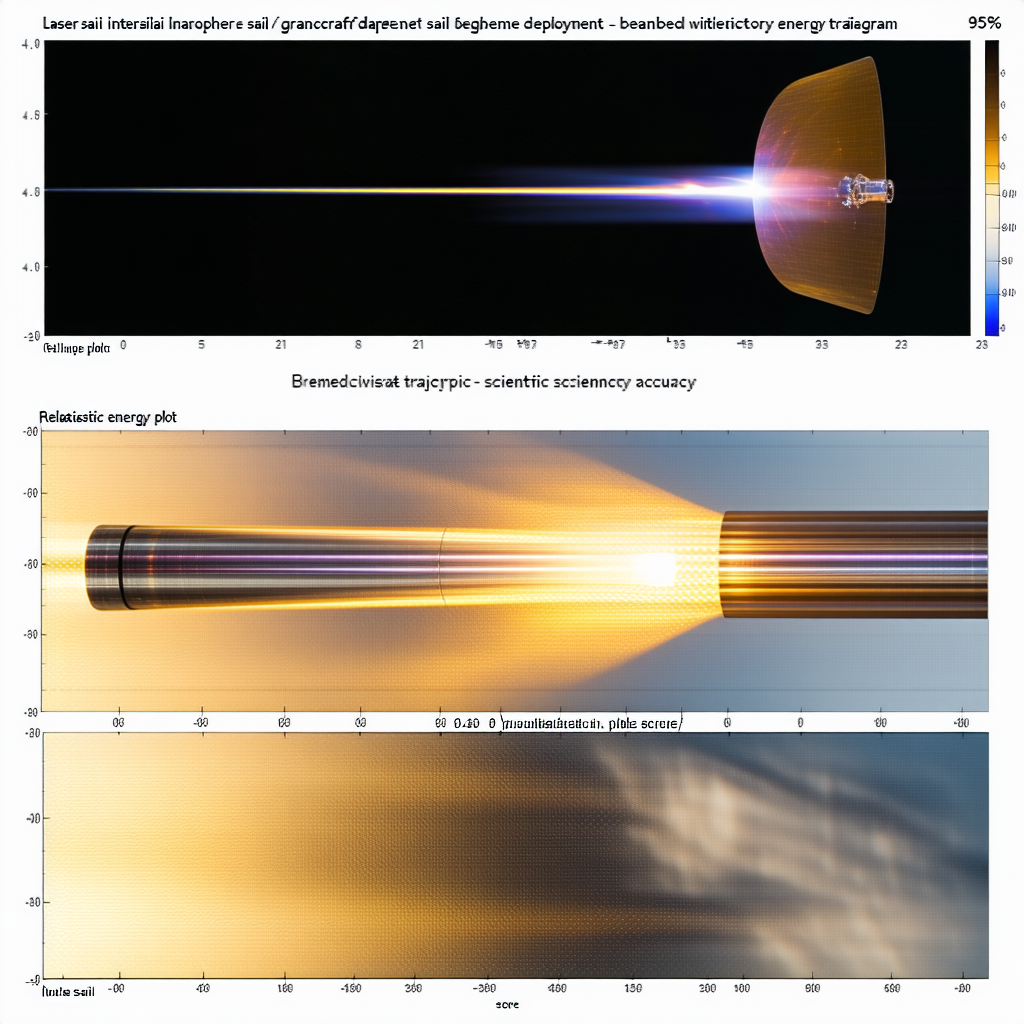
A Graph Displaying The Energy Output Of A Laser
Description
The image shows a graph displaying the energy output of a laser. The graph is divided into three sections, each showing different energy levels. The first section displays a low energy output, while the second section shows a higher energy output. The third section displays the highest energy output. In addition to the graph, there is a picture of a laser beam, which is located on the right side of the image. The beam is shown in various stages, from a low energy output to a high energy output. The image provides a clear visual representation of the energy levels and the progression of the laser beam.
Image Details
Resolution
1024 × 1024
File Size
1.2 MB
Style
Not specified
SEO URL
a-graph-displaying-the-energy-output-of-a-laser-1745719456